

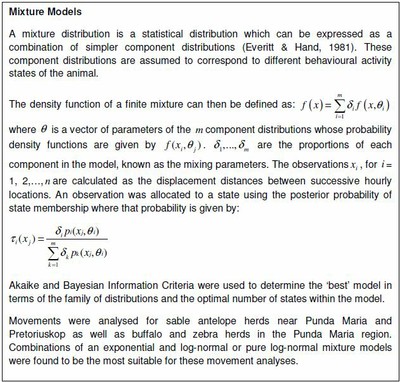
Independent mixture models assist in determining herbivore activity states
|

Recent advances in animal tracking technology have resulted in large volumes of data becoming available for analysis.
Global Positioning System (GPS) technology has enabled researchers to record the sequential movement patterns of animals and compile datasets with many more observations compared with older tracking techniques over a similar time period1.
GPS/Global System for Mobile communication (GSM) tracking technology is relatively new in South Africa and uses cell phone networks to transmit the GPS location coordinates for a collared animal at regular time intervals during the day and night. These data are then analysed in order to understand and explain the pattern of the animal’s movement, differentiate between time spent in feeding areas and time spent moving between foraging patches, identify changes in behaviour between migrating and breeding cycles and other ecologically important states.
Many different methods and techniques have been applied to ecological data and there are advantages and disadvantages associated with each type of analysis. Depending on the type of data and the desired outcome in terms of ecological explanation, various analyses can be used. A major challenge in the analysis of this growing volume of movement data is to link the statistical properties of the movement patterns to behavioural characteristics of the animal2. Most GPS tracking has been done in the northern hemisphere with few findings on African herbivore movement published3.
Kruger National Park study
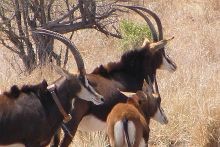
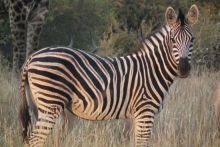
Since late 2003, GPS/GSM collars have been placed on several species within the Kruger National Park (KNP). The data used for this study were obtained from collars placed on sable antelope (Hippotragus niger), zebra (Equus burchelli) and buffalo (Syncerus caffer) in the northern region of the KNP, and some sable herds collared in the south-west of the park.
The expected life-span of the collar is one to two years depending on the battery unit and frequency of location readings. Generally location readings were taken at hourly intervals and the dataset spans the complete seasonal cycle. This information was sent via a cellular phone (GSM) network to a website from where the information was downloaded.
If the animal was outside cell phone reception, the location data were stored and then downloaded once the animal came into a reception area. This means that we have a dataset for each collared animal and from the X-Y location coordinates we are able to calculate the displacement between locations at discrete time intervals, as well as the direction of the movement.
These data needed to be interpreted with regard to the activities performed by these animals in particular places at different times of day. Mixture models were used in order to determine these activity states.
Sable were collared as their numbers have declined dramatically over the past couple of decades in the KNP and information was required about their ecology in order to assist management to conserve this species. The buffalo and zebra are bulk grazers in the Park and more information was required about how their movements compared with the sable and whether they were in competition with the sable for food resources and space utilisation.
Results
The component distributions describe the movements for the animals in different activity states and the mixing parameters indicate amount of time spent in each state for the herd. A 4-state model was selected as the ‘best’ model for all the data combined and for the seasonal models run for the dry season (sable and buffalo).
We assume that these states correspond to the animal resting, foraging, moving or relocating. During the wet season, a three-state model (resting, foraging and moving) was selected for the buffalo movement and a two-state model (resting and foraging) for the sable movement. This illustrates that the relocating state is not present during the wet season.
Models which took into account seasonal variation in movement rates performed better than models ignoring seasonal variation, indicating how animals changed their behaviour to cope with stresses of the dry season. Movement patterns also differed substantially between the sable, zebra and buffalo herds, and between the sable herds in the different regions of the Park, suggesting different movement strategies for the different herds and species.
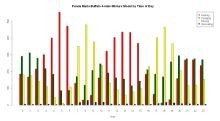
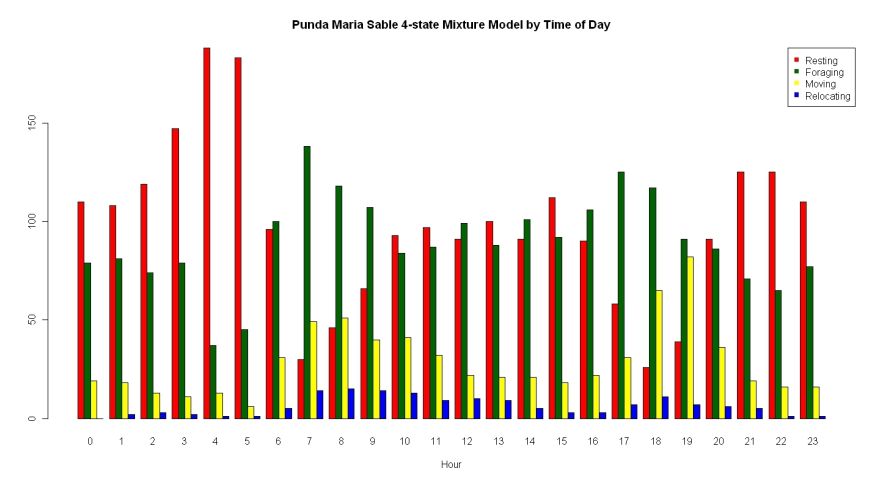
Figure 1 and Figure 2 show the allocation of states by time of day across the complete seasonal cycle. The sable herd shows a peak in resting just before dawn, and foraging continues throughout the day and night, with peaks after dawn and before dusk. The movement state also peaks during this dawn/dusk period. There is another resting spell around midday when the animals would be seeking out the shade to avoid being in the sun during the hottest part of the day. The long relocating movements which are assumed to be the treks to water begin around 7am and then return around 6pm.
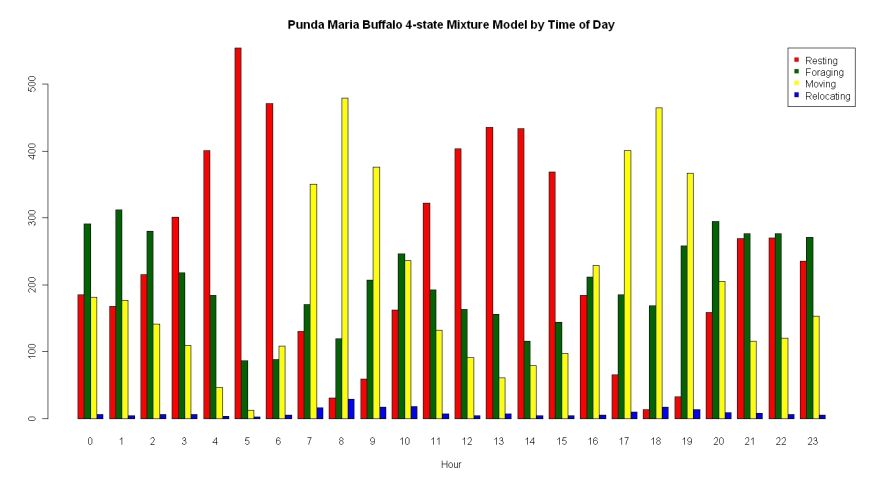
It needs to be kept in mind when looking at this analysis for the complete seasonal cycle, that the sunrise and sunset times would change over the year with the shifting seasons. The buffalo show two clear resting peaks, around sunrise and then from 11am – 3pm. Foraging can occur throughout the day and night, although is not as common around sunrise, when it seems the herd settles down to rest.
The buffalo show two clear movement peaks, more obvious than for any of the other species. These occur from 7am – 9am and from around 4pm – 8pm. Unlike the sable, the foraging state is actually the dominant state during the hours of darkness.
Conclusions
The models allow us to differentiate between different species and their movement strategies, while models run for separate seasons pick up the seasonal variation in behaviour. Spatial analyses could be used to distinguish the habitat patches used for foraging from those of the other activities.
Some of the challenges of using this technique are that the mixture model analyses assume independent observations and do not take into account the time series nature of the data. Mixture models are a form of clustering technique which allocates each observation to one state, which is not ecologically realistic in terms of an animal spending all of one hour in a particular state. In terms of future work, we propose using Hidden Markov Models as a follow-on analysis as this technique takes into account the time series nature of the data and allows investigation of the transition probabilities from one state to another.
Movement of animals and organisms is an important component of many ecological processes4. As this is a rapidly advancing area of science, new work is constantly being published and new methods investigated for the analysis of animal movements.
Breaking new ground
Our research aims to break new ground in terms of investigating multiple species in one location in Africa and applying statistical models to their observed movements. We hope that this work will contribute positively to the expanding field of movement ecology.
An understanding how animals are utilising space for various activities, will assist with management problems around habitat fragmentation, climate change, spread of disease and aliens and others.
1 Jonsen et al., 2005
2 Nathan, 2008
3 Rahimi & Owen-Smith, 2007; Owen-Smith & Cain, 2007
4 Nathan, 2008
References
Everitt, B., & Hand, D. (1981). Finite Mixture Distributions. London: Chapman & Hall.
Jonsen, I.D., Flemming, J.M., Myers, R.A. (2005) Robust state-space modelling of animal movement data, Ecology 86(11): 2874 – 2880.
Nathan, R. (2008) An emerging ecology paradigm, Proc Natl Acad Sci USA 105: 19050 – 19051.
Owen-Smith, N., Cain, J.W. (2007) Indicators of adaptive responses in home range utilization and movement patterns by a large mammalian herbivore, Israel Journal of Ecology & Evolution 53: 423 – 438.
Rahimi, S., Owen-Smith, N. (2007) Movement patterns of sable antelope in the Kruger National Park from GPS/GSM collars: a preliminary assessment, South African Journal of Wildlife 37(2): 143 - 151.


