
Vegetation type stability and change analysed over 44 years yields valuable results
|
Global change has become a topic of great concern. Unfortunately, long-term data records required to identify and examine how global change factors impact on ecosystems are rare.
South Africa’s highly dynamic and complex fynbos ecosystems are a case in point. While the spatial patterns and disturbance regimes of fynbos ecosystems have been the focus of extensive investigation over the past few decades2, logistics have mostly constrained these to once-off or short-term temporal studies, limiting our understanding of the dynamics of fynbos ecosystems over longer time-scales. Without long-term data it is impossible to gain an understanding of the natural dynamics and variation, or identify directional change in fynbos ecosystems.
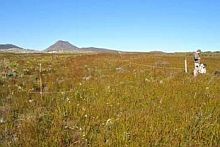
The Cape of Good Hope section (CGH) of Table Mountain National Park is one of the few fynbos sites for which we have a long-term record of vegetation dynamics. Hugh Taylor, a renowned fynbos ecologist, established 100 permanently marked 5x10 m plots throughout the reserve in 1966, identifying all species within the plots and classifying the flora of the reserve into different vegetation types.
Botanist Sean Privett and his co-workers performed a follow-up survey in 1996, locating and resurveying 81 of the original plots. They found that turnover in species composition within plots was 40% on average - and as high as 60% - over the 30-year time period. Species composition across the entire reserve was found to be relatively stable however, with species’ disappearance from some plots being balanced by colonisation of others between the two surveys.
In 2010, we located 67 of the original plots (many of the original markers have been lost!) and began a new survey. Twenty-six plots have been revisited and enumerated thus far, allowing preliminary analysis of vegetation stability over the 44-year period. The main aims of our initial study were to identify any directional change in species richness and composition and to investigate the stability of vegetation types over the 44-year time period. We explored fire history and soil type as local factors determining similarity or turnover in vegetation composition between plots and time periods.
Decrease in species richness
Species accumulation curves (Figure 1) using the 26 plots sampled during all three surveys show that there has been a steady decrease in observable species richness across the reserve between 1966 and 2010. Local factors that may be driving this trend include changes in grazing pressure or fire regime.
There has been a decrease in variation of vegetation age across plots, with vegetation generally being younger and of more similar age than before due to an increase in fire frequency between 1966 and 1996, and between 1996 and 2010. More frequent fires between 1996 and 2010 may also be the driver of greater turnover in species composition within plots over the 14-year period between 1996 and 2010 than over the 30-year period between 1966 and 1996.
This is further supported by a proportionally greater decrease in non-sprouting than sprouting species because some non-sprouters take five or more years to reach sexual maturity and start producing seeds, and may suffer local extinction if fires are too frequent. Unfortunately we have not yet been able to access data on herbivore stocking rates to explore changes in grazing pressure as a driver of vegetation change, but hope to do so in future.
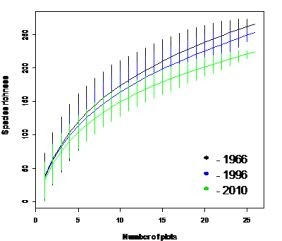
Fig 1. Species accumulation curves for plots from all three survey periods
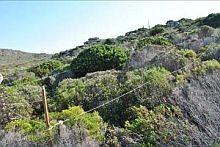
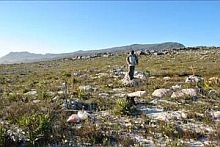
Vegetation composition analysis divided the plots into two major groups corresponding to fynbos and thicket-like vegetation types. The fynbos sites split into two groups that were relatively stable across the 44-year period. One consisted of Restioid vegetation occurring on sandy flats (green; Figure 2), while the rest included drier rocky habitats dominated by Proteaceae or Ericaceae (blue and red).
The rockier sites varied in the dominance of Proteaeceae or Ericaceae between the survey times depending on vegetation age, implying alternate states or different successional seres3 in these sites. Thicket sites included mature fynbos with forest elements and vegetation of coastal affinity (purple and white). A few anomalous plots also emerged, seemingly affected by changes in hydrology because they were dominated by typically wetland species at some survey periods and drier fynbos species at others.
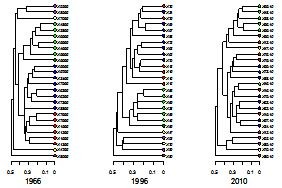
Fig 2. Cluster diagram of plots for three time periods grouped into vegetation types using Bray-Curtis distance coefficient. Colour coding in all diagrams indicates vegetation type inferred from 1966 cluster analysis. Larger groupings are generally stable over time but there is less stability within groups likely affected by disturbance regime.
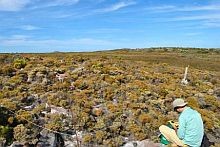
Vegetation classification based on the 1966 data, difference in vegetation age and soil type were all found to be significant predictors of compositional differences between plots. Broader vegetation groupings were generally stable over the study period, although there was little stability in the relationships between plots within groups. Thicket vegetation was not well predicted by soil type, but was constrained to areas that have not burnt for long periods of time, likely due to the time required for thicket species to establish. That some thicket sites have not burnt in approximately 80+ years implies that this vegetation may suppress fire.
The inclusion of new survey data for the remaining 41 plots will allow us to confirm or refute the trends in species richness and composition noted for the 26 plots. It will also allow us to further explore thicket and other non-fynbos vegetation that were not adequately sampled within the 26 plots.
Species richness may be affected by grazing pressure or altered fire regime, but more work is needed to confirm the effect of such impacts. Thus far we have only investigated the effects of fire frequency, but need to explore other components of the fire regime such as fire intensity, the season of burn and weather conditions following a fire. We also need to explore the influence of global change factors such as climate change or increased CO2 levels as opposed to changes in management practices and local human impacts as potential drivers of change in fire regime.
Species diversity is declining
Overall, it appears that vegetation types at Cape Point are determined primarily by soil type and environmental conditions and secondarily by disturbance, in this case the impact of fire regime, with broad vegetation groupings being relatively stable but species turnover within local sites being high. Detectable species diversity within the monitoring plots has declined over the three survey periods likely due to the reduction in the average age of vegetation within plots and the variation in vegetation age between plots. This is of great concern if the 26 plots monitored thus far are a fair reflection of the distribution of vegetation ages found across the reserve.
1 Stuart Hall completed this study for his Honours Project at the University of Cape Town. Data associated with the plots originally established by Hugh Taylor in 1966 in the then Cape of Good Hope Nature Reserve are archived by SAEON.
2 Jarman 1988, Cowling 1992, Privett et al. 2001
3 The stages of development that vegetation goes through following disturbance, such as fire that has destroyed the previous vegetation community, are known as seres. In classical northern hemisphere systems the vegetation may start out as grassland, become a shrubland eventually turn into a forest. In fynbos, changes in vegetation communities following a fire is less well understood and may not follow the same linear and predictable sequence of development.
Further reading
Cowling, R.M. 1992, The Ecology of Fynbos: Nutrients, Fire and Diversity. Oxford University Press, Cape Town.
Jarman, M.L. 1988. A description of the fynbos biome project intensive study site at Pella. Foundation for Research Development report series No. 33. Pretoria, CSIR
Privett, S.D.J., Cowling, R.M., Taylor, H.C. 2001. Thirty Years of change in the fynbos vegetation of the Cape of Good Hope Nature Reserve, South Africa. Bothalia 31,1: 99-115.
Acknowledgements
I am most grateful for help from many people involved in this project, firstly to Hugh Taylor and Sean Privett for data from previous surveys, as well as all other people involved in the two initial surveys. Dr Nicky Allsopp and others from the South African Environmental Observation Network (SAEON) provided much support in terms of environmental and photographic records as well as funding. Ross Turner for identification of species and locating plots. Adam Wilson and Cory Merow from the University of Connecticut for help in the field and collection of data. Jasper Slingsby for coordinating and help with statistical analysis, as well as previous work in relocating plots.