
SAEON scientist draws on marine data to respond to tragedy
|
One late Tuesday afternoon in March 2012, as I was about to leave work, I received a phone call from Carl Wainman of the Institute for Marine Technology (IMT).
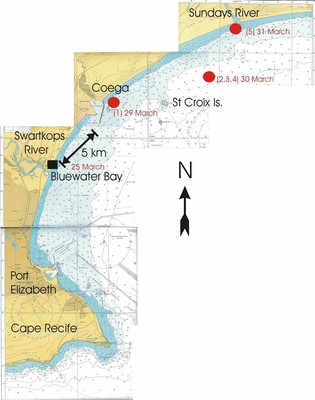
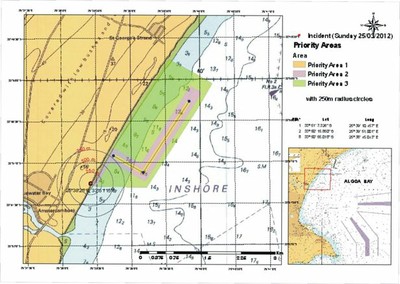
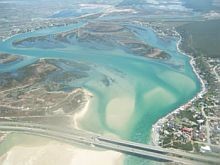
He asked if I was willing to assist the SA Navy/IMT in identifying search areas for a number of persons who went missing (feared drowned) on Sunday 25 March at Bluewater Bay, north of Port Elizabeth (PE) harbour, in Algoa Bay (Figure 1).
The tragic event which overtook a local rugby team, and other people, as they were swept out to sea by a large rip-current had been all over the news. I had been following the event as it unfolded and so naturally agreed to help.
A matter of urgency
Answers were needed by early the next morning (Wednesday), before search efforts resumed, and that left me little time. Although that was not really a problem, the major setback was that I had no data on which to formulate a solution as there were no real-time instruments measuring ocean currents in that area, or none that I had access to. SAEON had some underwater temperature recorders and current meters in Algoa Bay, but these were delayed-time instruments, which meant that the data could only be read off them once the moorings had been dived out by staff of SAEON’s Elwandle Node. By that time it would have been too late.
The South African Weather Service (SAWS) has weather stations at Port Elizabeth Airport and Coega Harbour which could be used for wind, but it would take some time before the data would be accessible. Tidal records from Port Elizabeth harbour were also not available, although I could get hold of tide charts; but then unusual water levels could not be determined. What was needed was real-time data.
Examining the prevailing conditions
Let us review the oceanographic conditions at the time of the incident, as reported by Ian Gray, the station commander of the National Sea Rescue Institute (NSRI) at Port Elizabeth. The incident began at about midday on Sunday 25 March at Bluewater Bay main beach, about 1300 m north-east of the Swartkops River mouth. The wind was a light to gentle breeze (< 10 knots) from the north/northeast, swinging to southwesterly later on. However, the currents were set in a northeastward direction, toward Coega Harbour.
There was a small (< 1 m) swell running from the southeast and the sea was slight to moderate. The tide was flooding, with a near spring low tide occurring about one hour earlier. The incident took place within 7-10 m from the beach at a sudden drop-off into an estimated 2 m deep gully. This gully fed a number of inshore-offshore (very-intermittent) rip currents that extended beyond the surf zone.
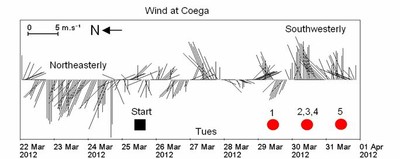
This report gave me a good idea of what had happened. The wind at the time of the incident was the tail end of a fresh northeasterly breeze that had been blowing for over three days (Figure 2). This had caused the local easterly swell observed on that day, which was already beginning to drop. From the research of Talbot and Bate (1987a) we know that during these conditions the number, frequency and intensity of rips increase in the western side of the bay, around the Swartkops River and also southward towards Port Elizabeth (these rips are usually more prevalent along the shoreline east of Sundays River).
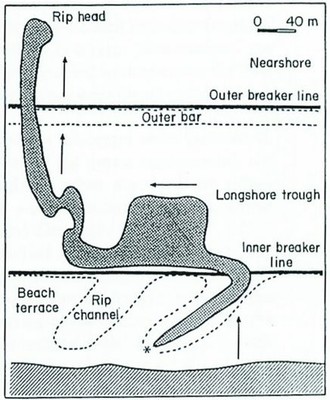
It is clear that these "exchange rips" were active during the incident, and were of the type D (Figure 3) as described by Talbot and Bate (1987b). These “mega rips” can have offshore fluxes across the breaker line by as much as 80 m3s-1.rip-1. Once the water was beyond the surf zone it moves under the influence of bay-scale and open ocean dynamics where winds, tides, inertial (residual) currents and even the Agulhas Current play an important role in the circulation.
Satellite imagery
I then looked at satellite imagery provided by the Marine Remote Sensing Unit, which showed that there was no Agulhas Current influence on bay waters at that time, since it was located at its “normal” position at the shelf break. Tidal currents on a flooding tide probably peaked at the time of the incident, or were at least very strong, and must have played a (unknown) role in the strength and movement of the rips. Without data, inertial currents were difficult to determine, so that left only wind to work with.
Without real-time data, and short on time, I proceeded to download WindGuru modelled historical data (acknowledgements to WindGuru), and processed the data into a format that I could use. Roberts (2010) showed that wind was a major factor in driving currents in the near-shore zone of the eastern section of the bay, as it was further offshore (Goschen & Schumann, 1988).
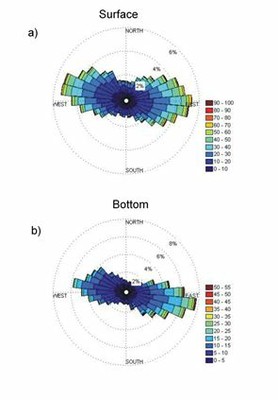
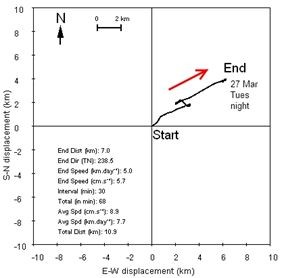
From previous studies in Algoa Bay it was found that surface currents in the bay can be estimated from wind stress via an imperial formula, and (Goschen et al., 2012, Pattrick et al., in prep.) show that the bottom currents are approximately half that of the surface currents (Figure 4). From this knowledge, progressive vector plots of the currents between Sunday and Tuesday night were plotted (Figure 5), which showed that by Wednesday morning the bodies would have drifted a minimum of 3 km and a maximum of 7 km towards the northeast (Coega).
Hydrodynamic model
Carl Wainman had also asked the CSIR (Dr Hardus Diedericks) to run their hydrodynamic model of Algoa Bay, and it was found that there was good agreement between my scenario, the CSIR model and the NSRI predictions. Figure 6 shows the initial (Wednesday morning) combined search area, compiled by Carl Wainman and his IMT Maritime Rapid Environmental Assessment group.
Unfortunately, by this time the bodies had probably sunk to the bottom and could not be found. I was then phoned by John Best of PE Disaster Management to give a prediction for Thursday morning. What I wrote was “the bodies would probably have moved further towards the NE and slightly further offshore. I would estimate now (Thursday morning) about 5-7 km NE from Bluewater Bay and about 1-2 km offshore, just south of Coega Harbour”. By Thursday afternoon the first body was found off the Coega harbour wall, five days after the incident. I was congratulated by John Best saying: “We have just found the first body in the area you identified”. PE Disaster Management now had a solid foundation from which to base their further searches.
By Friday, 30 March, as a strong southwesterly breeze began to blow, three more bodies were found north of St Croix Island, about 4 km from the shoreline. The fifth and final body was found off Sundays River mouth the next day (see Figure 1).
In conclusion, our marine science scenarios proved to be very successful. With my knowledge of the area, and with very little data, I was able to determine the most plausible search area and all five bodies were recovered. In hindsight, perhaps our models underestimated the strength of the nearshore northeastward current, because the location of the fifth body off Sundays River came as surprise to me (it had moved about 25 km in six days), although it was in the general search area and the southwesterly wind did pick up.
For me, as a physical oceanographer researching Algoa Bay, this exercise re-affirmed the concept of a general cyclonic circulation in the Bay. It also shows that marine science is applicable in real-life situations. For disaster management, coastal planning and research, it is clear that operational oceanography is needed in the Bay.
Most important of all, it was the return of loved ones to their families that really mattered.
References
- Goschen W. S. and Schumann E. H. (1988). Ocean current and temperature structures in Algoa Bay and beyond in November 1986. South African Journal of Marine Science 7: 101-116.
- Goschen W. S., Schumann E. H., Bernard K. S., Bailey S. E. and Deyzel S. H. P. (2012). Upwelling and ocean structures off Algoa Bay and the southeast coast of South Africa. Accepted African Journal of Marine Science.
- Pattrick, P., Strydom, N. A., Goschen, W. S. (in prep.). Towards an understanding of the current complexity in a shallow nearshore fish nursery in Algoa Bay, South Africa and the implications for larval fish transport. Estuarine, Coastal and Shelf Science. (about to be submitted).
- Roberts M. J. (2010). Coastal currents and temperatures along the eastern region of Algoa Bay, South Africa, with implications for transport and shelf-bay water exchange. African Journal of Marine Science, 32(1):145-161.
- Talbot M. M. B and Bate G. C. (1987a). Rip current characteristics and their role in the exchange of water and surf diatoms between the surf zone and nearshore. Estuarine, Coastal and Shelf Science 25(6): 707-720.
- Talbot M. M. B and Bate G. C. (1987b). Distribution patterns of rip frequency and intensity in Algoa Bay, South Africa. Marine Geology 76(1987): 319–324.
|