
Distributed charting services
SAEON recently completed development work on a web application for the on-line creation of charts and tables.
The data sources for these charts and tables can be anywhere in the web, and provided they conform to one of a growing number of supported standards, the application is capable of streaming data from such sources to create composite charts and tables. The application will be released as part of a revised Risk and Vulnerability Atlas, which is nearing completion.
Wim Hugo explains: “SAEON has been instrumental in developing a shared platform1 for data discovery and dissemination that is currently used by a number of institutions and projects, including SAEON itself. One of the major requirements that has not been addressed to date, is to explore and visualise non-spatial (i.e.tabular) data prior to download or acquisition - as has been possible for some time now for spatial data sources.”
Observation data has traditionally been stored in comma-delimited text files, but the global trend is increasing use of standardised services, such as SensorWebs2. In addition, time series are often derived from remotely sensed data3, and are difficult to work with for non-specialists, having near-continuous space and time dimensions, and usually being quite large.
By implementing a common interface for users, irrespective of the type of data source, the new application removes many of the hurdles to exploration and evaluation of resources discovered through the SAEON-supported platform.
Supported data sources
The development team has focused on readily available data sources and standards, and has completed work on the following:
- Any comma-delimited text file can be used as an input, provided it is fairly well structured in rows and columns;
- Sensor Observation Services can be read and utilised;
- OGC Web Feature Services can be used as data sources;
- A special adapter was implemented for the Meraka Institute’s WAMIS time series data - these are derived from NetCDF and HDF data files.
The project team will, in the near future, focus on incorporating generic NetCDF and HDF services, which will, among other benefits, allow tabular and time series data from climate projections to be accessed in the same way.
How does one use it?
“In the very near future, registered contributors and editors of the SAEON-supported data portals will be able to create blank charting views at any suitable location in these portals, and by searching for data, find suitable services that can be charted or tabled for future use,” explains Wim. “Users can also decide to embed the charts into other web applications or pages, as the example shows. Such charts can display controls, for amendments and modifications - or hide them, depending on requirements.”
The example shows a Normalised Differential Vegetation Index time series, hosted by WAMIS at the Meraka Institute, CSIR, together with SAEON observation data (hosted in MetaCAT) that monitors a collection of tree species in respect of diameter changes over time. As can be inferred from the example, any number of such data sources can be ‘mashed up’ in a chart or table view, and the data series need not be simple; the application can deal with multiple series within the same data source.
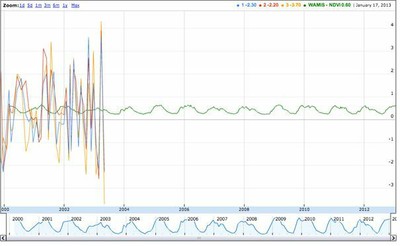
Click to enlarge
Best of all is that the charts and tables remain up to date: they are dynamically linked to their web-distributed data sources, and are refreshed whenever a page is re-opened.
The application was developed as a JavaScript component, using Google Charts for visualisation of data.
1See http://data.saeon.ac.za and http://data.dirisa.org for examples.
2Read more at http://en.wikipedia.org/wiki/Sensor_Observation_Service
3Typically as NetCDF and HDF-4 services