
Will your data be understood 80 years from now?
|


"Send me an email, drop me a line, stating point of view
Indicate precisely what your data mean, into the archive forever we hope?
Give me your answers, fill in the form, data should be seen
Will we still need yours, will we still use yours when you're off the scene?"
(with apologies to Lennon & McCartney's When I'm 64)
A component of SAEON's vision is to "deliver[s] long-term reliable data for scientific research". This is in line with an international drive to archive digital data for the long term, an initiative which is long overdue but is gaining momentum.
Archiving digital data is an expensive and ambitious commitment which requires secure funding, flexible digital architecture, suitably qualified personnel and the support of all data generators who wish to, or are obliged to contribute their research data for archiving.
|
Since the establishment of SAEON in 2002, numerous SAEON eNews articles have discussed data, metadata and ontologies1 from various angles. SAEON eNews is full of interesting and useful information for data generators which can be accessed by typing appropriate keywords in the Search window found on SAEON's web page.
SAEON's data portal is also rich in guides to assist you to Work with metadata (2012), Add[ing] Meta-Data Manually (2011), Guidelines for Data Providers and Custodians (2011), and Guideline for Meta-data Management in SAEON (2010). Metadata standards1 support is provided to assist you to select the standard you require for your data type in order to successfully archive the data sets in a repository.
All documents and SAEON eNews articles are freely available to download and consult and do not require registration on the SAEON data portal.
Writing metadata is not scary!
Back to the question I posed in the title of this article - what can you do to ensure that your data will be understood 80 years from now? Writing metadata is not scary, nor is it time-consuming to produce if it is generated in parallel with data collection. In fact, it is a good way to ensure neat, accurate and user-friendly data that will help you to keep track of what you did when collecting the data.
Originally the term metadata was used for the detailed description or documentation of data which could be understood and shared or harvested by computers (hence the need for appropriate ontologies), but it is now used more broadly. Repositories will make it easy for you to archive data by providing advice on the metadata language your data require and in many cases providing an interactive tool to archive the data. If you make data documentation part of your workflow, the onerous part of metadata is already done.
Retro-describing data is a fascinating (for some!) and time-consuming task, particularly if the data manager and data generator is not the same person or does not have access to the person or people who were the data generators. To give you an example - to produce metadata for one streamflow weir, Biesievlei G2M02A in the Jonkershoek valley, takes days of poring through documentary evidence collected by past researchers. Fortunately the evidence is good and many of the more recent researchers are contactable, although nearing retirement!
SAEON's decision to revive the long-term monitoring of a range of South African mountain catchments was motivated by the availability of a comparatively complete 80-year long-term environmental monitoring data set. The mountain catchment hydrology experiments were originally set up by the South African Forestry Research Institute back in the 1930s. This research institute became FORESTEK, a division of the Council for Scientific and Industrial Research, but the experiment was eventually closed in the 1990s.
Where? What? Why? How? When? Who?
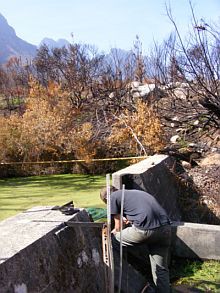
What are the elements required to enable you to understand the data gathered by instrumentation at the Biesievlei weir?
First of all you would want to know Where the research took place? Biesievlei is the name of a stream and a water catchment in the Jonkershoek Valley in the South Western Cape, South Africa. A biesie is a reed or a bulrush and a vlei is a marsh or wetland in Afrikaans.
This may appear to be a contradiction, to call a stream a vlei? I can only speculate that Jan de Jonkher, who was granted the valley in 1692, had so many rivers and streams on his property that he needed to identify them. This particular stream must have ended in a vlei full of biesies that has disappeared since the catchment was planted up to pines, or may be incorporated into the stilling pond. If you would like to look it up on Google Earth, here is the geographic location: 33o 58' 21" S 18o 56' 56" E, but don't blame me if it does not take you directly to the weir because that geographic location was documented prior to hand-held GPS devices2.
Then you would want to know What was measured? In this case researchers were measuring streamflow from a specific mountain catchment, the Biesievlei catchment. Streamflow was (and is) measured in two ways, volume and amount of runoff.
The next question is Why? Why monitor streamflow in mountain catchments? In the 1930s this was done to establish whether the planting of exotic timber did indeed cause rivers to dry up, as farmers had complained was happening. It took a while, but this was indeed proved by monitoring the streamflow while applying various 'treatments' such as timber planting, burning, leaving native vegetation undisturbed. Why does SAEON want to continue the monitoring? You will have to read the June 2010 SAEON eNews article to find out.
How was this done? This is where the technical descriptions of weir construction, gauging apparatus, types of measurement output, correction factors and a range of other standard calibrations and calculations get documented.
A stilling pond behind the weir had to be created to ensure that gauging could be regularised and this had to be cleaned for silt accumulation from time to time. Occasional water level surges caused by a summer cyclist taking a cooling dip in the stilling pond would be speculative metadata, but vegetation caught in the V-notch of the weir is real metadata and is recorded along with other factors which may have caused irregular data.
The question When? has two levels: (i) the beginning and end of a research project and (ii) data output frequency. The Biesievlei weir was monitored from 1 March 1938 to 15 February 1995 and data output frequency was runoff in mm/hour and volume in m3/hour. My calculation for 48 readings per day at an average of 30 days per month at 12 months per year, from 380301 to 950215 comes to approximately 984,960 digital readings from one weir. The mountain catchment hydrological experiments involved multiple catchments with a multiplicity of weirs – a lot of data to archive.
We're not finished yet! Who collected these data? Repositories want to know all about data ownership, full details please! Who can be contacted for permission to use the data, are the data part of an umbrella project? Who should be cited when the data are re-used?
So many questions - but if you want someone to be able to understand and use your data in 80 years' time in order to contribute to an understanding of our environment, then this is what it takes.
1 An ontology is a formalised list of names and definitions to describe all components of a field of research. The article by Deshendran Moodley and Avinash Chuntharpursat in SAEON eNews, April 2007 gives a good introduction to the concept, and includes a link to an ontology tutorial available through Stanford University.
2 See http://data.saeon.ac.za/metadata/standards-support for a range of environmental metadata standards.
3 Revised coordinates are -33.976608o 18.948259o These are in decimal degrees provided by Google Earth.
|