
Cedar-Zen science!
|


Citizen science - "science done by ordinary people, often for or with the help of scientists" - Cambridge dictionary
Zen - "emptying the mind of thoughts and giving attention to only one thing"- Cambridge dictionary
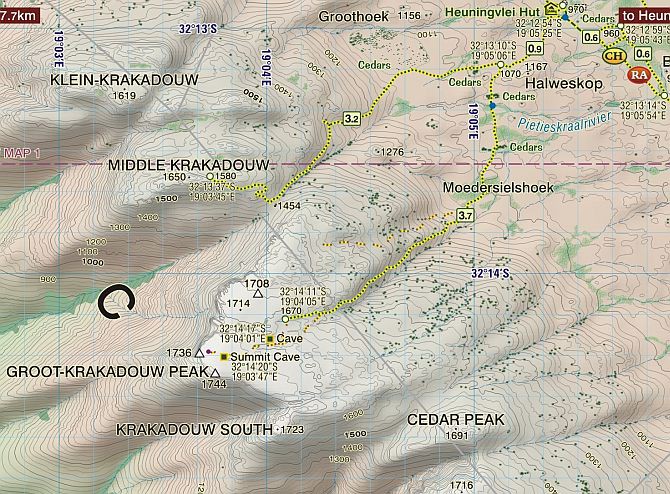
An odd title perhaps, but how best to describe the efforts of Capetonian cartographer Peter Slingsby, who spent some 200 hours using Google Earth imagery to map more than 13 000 precise locations of the Clanwilliam Cedar (Widdringtonia cedarbergensis) for the revised edition of his map Hike the Cederberg (Figure 1)?
|
"THIS is exciting!" said Associate Professor Ed February of the University of Cape Town’s Department of Biological Sciences and long-time cedar researcher. The development of this dataset gives us a near-perfect fine-scale description of the Clanwilliam Cedar’s distribution, allowing estimates of population numbers, providing a detailed baseline that allows monitoring of future change, and allowing inference of fine-scale habitat preferences that could lead to a better understanding of the species’ ecology and causes of its decline.
The sad, mysterious decline of an iconic tree
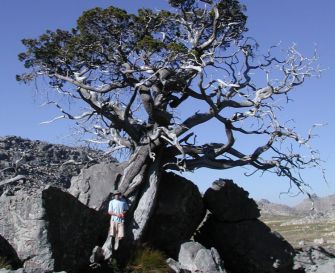
The Clanwilliam Cedar (Figure 2) is a long-lived tree, endemic to an area of approximately 250 km2 in the Cederberg Mountains, and is currently listed by the IUCN as Critically Endangered. It is the namesake of the Cederberg mountain range and was the driver behind the declaration of the Cederberg Wilderness Area in 1973.
|
The cedar wood was much sought after by early settlers due to the paucity of good timber in the Cape region and rapidly led to a noticeable decline in population numbers. Felling of live cedars was banned in 1879, making it one of the first protected species in the world, and the sale of dead cedar wood was restricted in the late 19th century and banned in 1967.
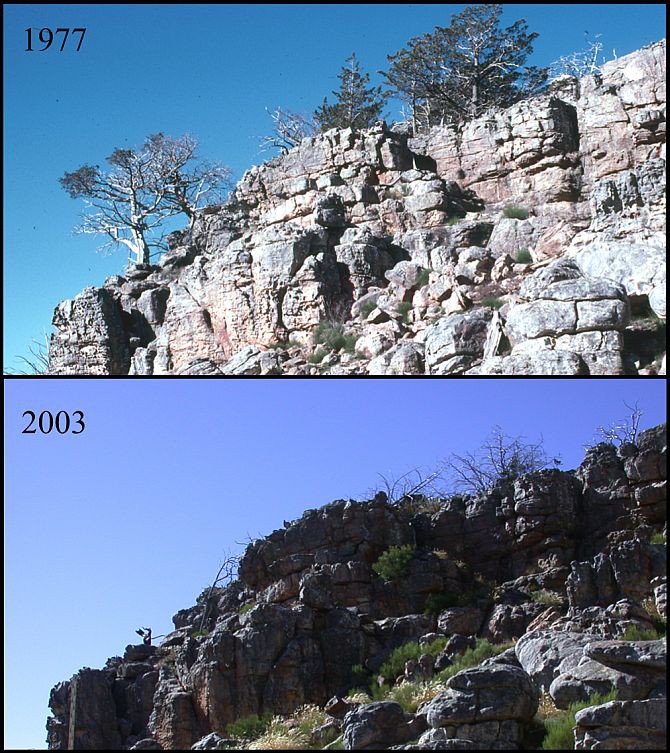
Unfortunately, tree numbers have continued to dwindle, and monitoring of permanent plots indicates a >90% decline in mature individuals between 1977 and 2003. While a detrimental fire regime is commonly cited as the dominant cause of mortality, observations of high numbers of dead trees in the absence of fire has researchers suspicious of other drivers such as increased drought stress due to climate change, as witnessed for the Atlas Cedar (Cedrus atlantica) in Algeria and Morocco, or pathogens similar to the Mountain Pine Beetle that is ravaging the pine forests of North Western United States.
Zen and the art of tree mapping
When asked what drove him to spend so much time mapping the trees, cartographer Peter Slingsby replied, "Wouldn’t it just be cool to have them on the map?"
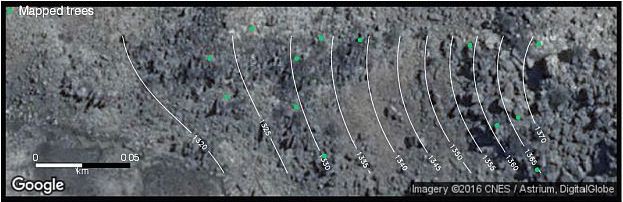
Tree localities were manually mapped from high-resolution imagery available from Google Earth Pro based on canopy colour and shadows (see Figure 3), and, where possible, verified with ground photographs from a publicly contributed archive accessible through Google Earth and a personal collection of 19 000 georeferenced images from research for the Cederberg hiking map. While there may be errors or omissions, this provides a very good indication of the locations of adult trees with live canopies.
Accuracy may vary depending on topography, the similarity of co-occurring species, and the recent occurrence of fire; but error rates for localities are likely to be low.
"...there’s an area near Krakadouw which has not burned and here the process was difficult; I may have selected some incorrect species - affecting perhaps 200 trees. Nevertheless, the cedars are usually a distinctive colour, and their shadows always give them away", states Slingsby on his blog about the Hike the Cederberg map.
Checking the numbers
An afternoon spent enumerating all cedars in a defined area on a small ridge of the Sneeuberg revealed some interesting comparisons. SAEON’s preliminary ground survey revealed 16 large adults with healthy green canopies >4 m2, while the Google Earth survey revealed 13.
|
This difference is explained by small clumps of trees being mapped as one individual, because of the difficulties of discerning multiple individuals from above. In addition, we mapped 32 large adults with <1 m2 live canopy, 22 sub-adults (0.25 m2> and <1 m2) and 36 seedlings (<0.25 m2), none of which can be discerned from satellite imagery.
While this suggests that actual numbers may be much larger than obtained from the Google Earth survey, this was one of the healthier stands we have encountered and the population structure is likely to vary greatly across the Cederberg, cautioning against extrapolation. Improving the population estimates requires further surveys, stratified across environmental gradients and spanning the species’ full range.
Unfortunately, there is still strong evidence of a dramatic decline, even in this stand. Our ground survey revealed 192 dead trees (i.e. a ratio of two dead to every live tree), made up of 96 adults, 74 sub-adults and 22 seedlings, many still bearing dead leaves.
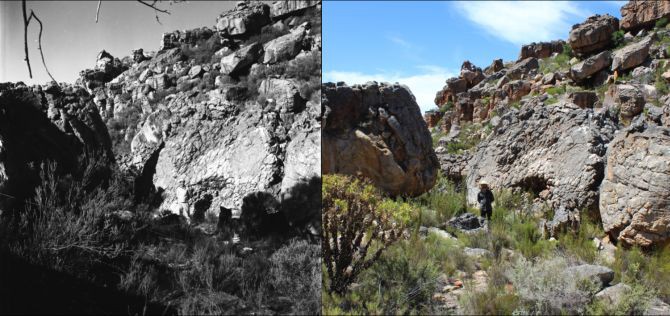
Recent work by Profs Ed February and Timm Hoffman and other researchers from the Plant Conservation Unit at the University of Cape Town (UCT) using repeat photographs (see Figure 4) suggests that this decline is consistent across the species’ range, but is more dramatic in lower elevation sites with higher temperatures and more frequent fire (White et al., submitted manuscript).
|
Where do cedars call home?
The mapped tree localities allow a rough-and-ready exploration of the cedar’s habitat preferences in relation to topographical features derived from a fine-scale digital elevation model, revealing some interesting aspects of the cedar’s habitat preference (Figures 5 and 6).
|
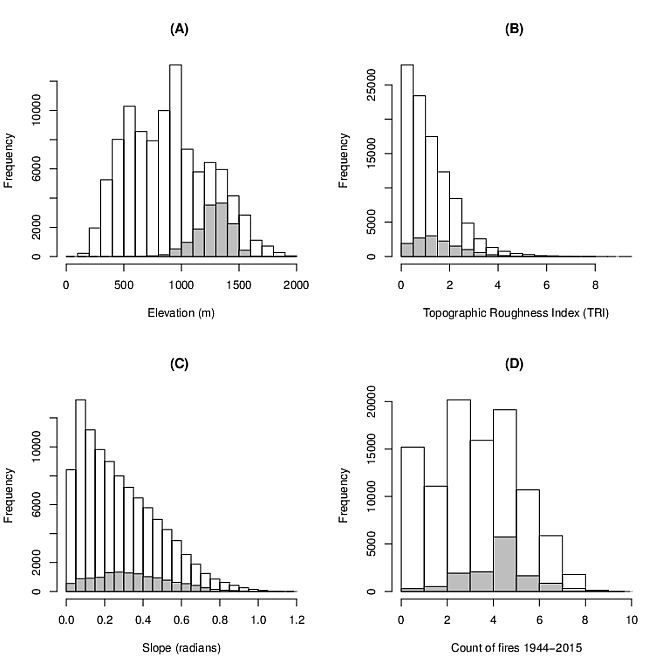
Compared to a random sample of the available habitat, the species is more frequent at mid-to-high elevation sites (950 to 1500 m) on gentle to steep slopes with a higher Terrain Ruggedness Index (TRI - a measure of the variation in elevation in the area immediately surrounding a site). It is thought that the cedar prefers rugged terrain since rocky outcrops can provide refuge from fire.
|
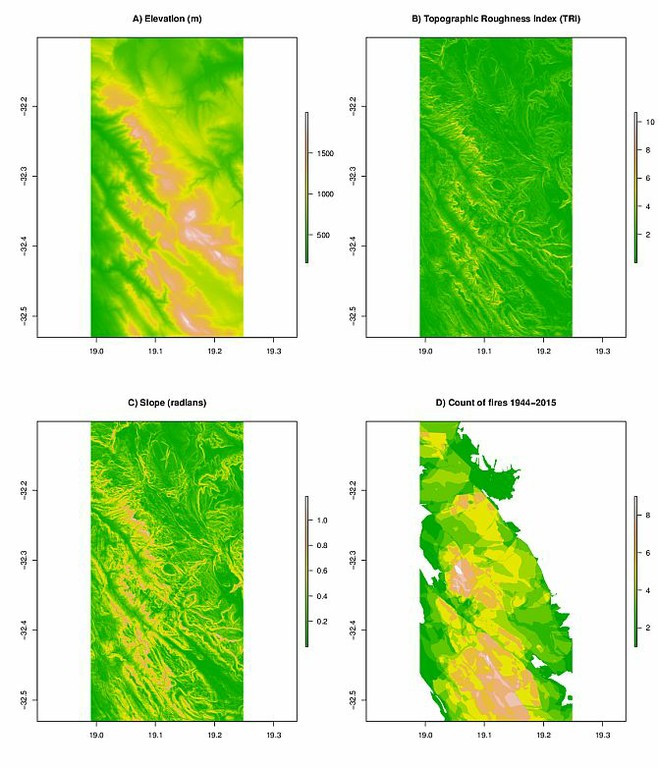
Exploring C.A.P.E.’s fire history data for the Cederberg (available from http://bgis.sanbi.org/) reveals that the species occurs in sites where intermediate numbers of fires have been recorded over the past 70 years. Its rarity in sites with no or very low fire frequency in this analysis is likely because the mapped extent includes a portion of the arid Tanqua Karoo (top right of Figure 6D), which does not burn, but is too hot and dry for the cedar.
More thorough analyses of this nature, combined with further detailed habitat and climate data, have the potential to provide good insights into the species’ ecology and drivers behind the waning population numbers.
Where to from here?
The Cederberg has come to the fore as a site for SAEON to build on as a focal research area due to its iconic status within the Cape Floristic Region, the existence of many valuable long-term ecological datasets, and the support, willingness and enthusiasm of neighbouring landowners and staff within the conservation authority overseeing the Cederberg Wilderness Area and Matjies Rivier Nature Reserve (CapeNature).
|
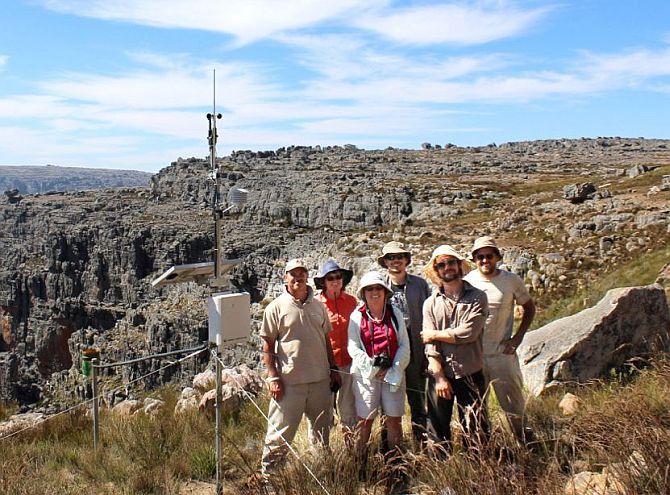
In collaboration with UCT and CapeNature, SAEON have recently begun deploying a network of weather stations and tipping-bucket rain gauges to better understand climatic variation in the reserve (Figure 7), and have been searching for permanently marked vegetation plots set up and surveyed by Hugh Taylor in the period 1986-9 (Figure 8), with the aim of performing a modern survey to explore vegetation change.
|
There are also historical demography datasets for a number of charismatic species (e.g. Protea cryophila, Protea nitida, Protea laurifolia), among other monitoring datasets and sites set up by the former South African Forestry Research Institute that have potential to provide long-term records for the area.
This article is dedicated to the late Patrick Lane, former manager of the Cederberg Wilderness Area, whose passion for the Cederberg and its people, the flora, and the Clanwilliam Cedar in particular, will remain an inspiration to all who knew him.