
Time capsule adventures in Data Land
|


Investigating historical data is my forte as there is nothing I enjoy more than sleuthing...
Over the past year I have spent time sifting for metadata and data in the HydroMet and Ecology Vaults at the Council for Scientific and Industrial Research (CSIR), Stellenbosch, with the assistance of a variety of DST-NRF interns.
How useful are these data and metadata you may ask? Essential for an understanding of our changing climate and landscapes!
Forest Influences Research Project data
SAEON eNews has published a number of articles about the long-term catchment monitoring that was initiated by the then Department of Forestry. The sites were taken over by the CSIR and continued by SAEON in Jonkershoek in the Western Cape and Cathedral Peak in the Drakensberg mountains of KwaZulu-Natal.
In 2010 SAEON’s Fynbos Node took over the CSIR’s digitised versions of the data that had been collected over the years from all the catchments that were monitored around South Africa. An inventory of the HydroMet Vault, where all the analogue data and metadata are stored, has shown that many more data sets await digitising.
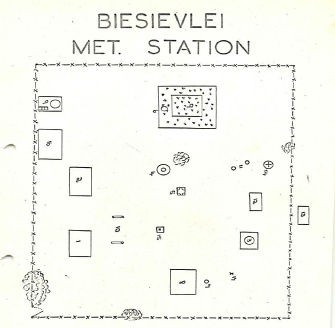
One of these is the Biesievlei weather station (Figure 1) that was in operation in Jonkershoek from 1 October 1944 until 27 December 1973.
|
Biesievlei historical temperature data
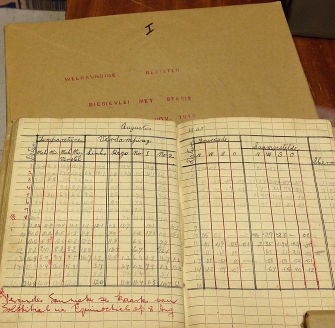
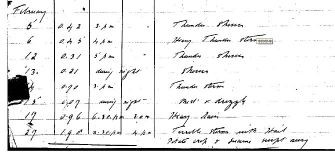
As temperature data are scarce, I set about digitising the maximum/minimum temperature data from the Biesievlei manual weather station, a station that no longer exists in the field but is very much alive in data registers. The data were recorded daily in field notebooks (Figure 2) that were then transcribed into the data registers back at the office.
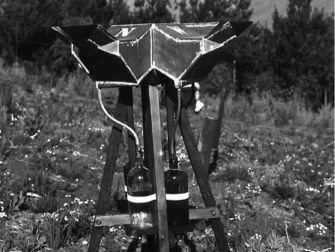
The Biesievlei registers contain a 30-year snapshot of rainfall, relative humidity, radiation, sunshine hours and wind that remain un-transcribed. One of the rainfall collection instruments at Biesievlei was a Fourcade gauge (Figure 3), an instrument with four vertical apertures facing north, east, south and west, with one horizontal aperture.*
Back then, field technicians lived in the valley and were able to note the weather changes on a 24-hour basis, such as fog, frost, hail, snow, the precise times of thunder storms, the arrival of cold fronts and other phenomena that could not be made by field equipment, but were recorded as comments in the registers (Figure 2).
|
Cathedral Peak digitised data
During my first year as SAEON’s Data Librarian, I conducted a detailed study of Cathedral Peak digitised analogue chart data on behalf of the Grasslands-Forests-Wetlands Node. Much of the available digitised data from the CSIR had not yet been uploaded to the SAEON Observations Database, mainly because the data required verification which, in turn, required a more detailed knowledge of the metadata behind each data set.
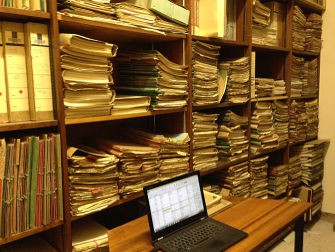
Once I started inventorising the HydroMet Vault (Figure 4), it became clear that there were considerably more long-term data remaining in analogue format that would be useful and contribute to better accuracy in the assessment of the temperature, rainfall and stream runoff at the Cathedral Peak site. These data sets have been identified. The next step is for the scientists to assess their importance and thereafter to ensure that they are digitised and find their way into the Observations Database.
|
The Clanwilliam Cedar and a photo album from the 1950s
This year I undertook an inventory of the Ecology Vault at the CSIR to identify any additional ecological data and metadata that had not been identified by SAEON during 2013. In particular I was looking for any data and metadata relating to the iconic Clanwilliam Cedar (Widdringtonia cedarbergensis), the re-establishment of which has occupied the minds of scientists, Cederberg managers and the public since the 19th century.
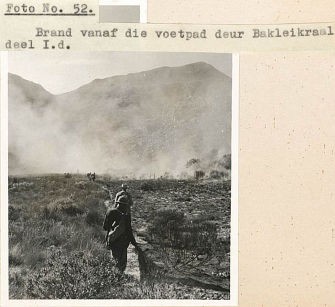
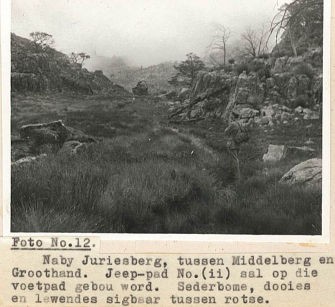
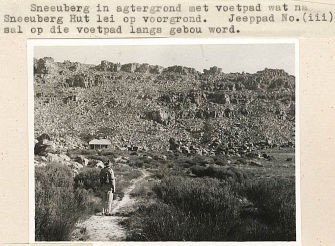
Among the Cederberg data and metadata, I found an undated document entitled Sederberg Brandbeskermingsplan foto’s (Cederberg Fire Protection Plan photos) that accompanied the Brandbeskermingsplan (Fire Protection Plan) 1957/58 – 1966/67. I was intrigued, particularly as these photos provided a snapshot in time of the area (Figures 5-7) and were illustrative of firebreak burning methods to protect the cedars.
|
I also rediscovered the field data sheets (Figure 8) for a 1970s demographic study of Widdringtonia cedarbergensis, and was able to contact the now retired researcher who was more than willing to spend time helping me write up detailed metadata so that future scientists can repeat the field study.
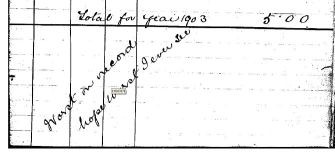
Farmer rainfall records
Another fascinating project has been working with farm rainfall registers. Farmers such as the Murray family of Bloemhof farm, have provided their rainfall records to the South African Weather Service for over a century. What has not been incorporated are the farmers’ comments (Figures 9 and 10) about the hardships of farming in harsh landscapes and the contextual information about weather patterns and changes in farming methods that cannot be collected by a rain gauge.
Digitising these comments made me feel like a participant in the day-by-day struggle to maintain a valued farm as a viable enterprise and not give up against the constant challenges, many related to weather.
|
As mentioned in a recent SAEON eNews, farm rainfall data are “a major opportunity for science”. Each farmer who contributes rainfall records to either the South Africa Weather Service, SAEON, or both, improves the quality and resolution of the derived gridded data sets that interface with Google Earth and that can be downloaded from the Climate Research Unit, University of East Anglia.
Citizen-scientist solutions
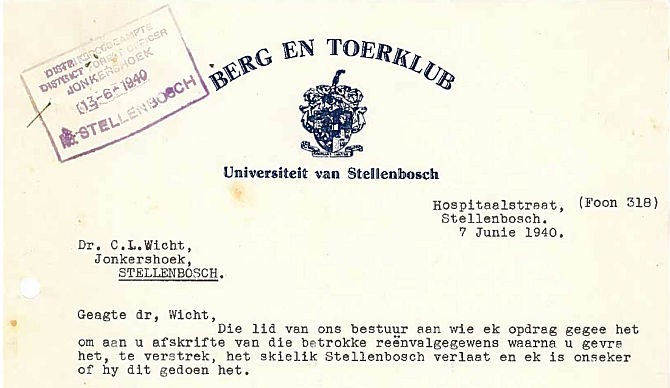
During the initial years of the Forest Influences Research Project in Jonkershoek, C.L. Wicht, research officer in Jonkershoek, had established rain gauges on the summits of The Pieke in 1939 and was dependent on the members of the University of Stellenbosch Berg en Toerklub (Mountain and Tour Club) to visit and note the monthly rainfall figures.
Accuracy was somewhat haphazard, with gauges overflowing between winter visits. Encouragement was provided by the Bosnavorsingsbeampte (Forest Research Officer) in the form of stamped envelopes so that the mountaineers could save on postage. The summit rainfall project was stopped in May 1940 when the mountaineer responsible for the task het skielik Stellenbosch verlaat (left Stellenbosch suddenly).
|
We will never know why!
* Fourcade, H.G. 1942. Some notes on the effects of the incidence of rain on the distribution of rainfall over the surface of unlevel ground. Transactions of the Royal Society of South Africa 29:235-254.