
Cloud processing remotely sensed datasets
|


In the recent past, the types of analyses that could be performed on remote sensing datasets were severely restricted by factors such as the imagery cost, computational capacity, storage space and bandwidth available to the researcher.
Analysis of remote sensing datasets was therefore typically confined to analysis of a few images over a limited time frame.
While a wealth of information and research has come out of this approach, the datasets that are produced can be of limited use due to the lack of sufficient spatial coverage, or lack of granularity with regards to the time series that the analyses were performed on. Analysis of continental scale datasets with a high spatial and temporal resolution was limited to the research organisations that had the resources to utilise high performance computing facilities, which limited the research scope to endeavours that would justify the cost of the analytical time and the purchasing of high resolution imagery.
Recent developments in the form of free publicly available satellite imagery, cloud computing and public access to large data archives via Application Programming Interfaces (APIs) have enabled the research scope to widen considerably. The advances that Google (in the form of Google Earth Engine API) and Amazon’s web services (accessed via Sentinel-hub API) have made in the realm of cloud computing of remote sensing data, have made it significantly quicker and cheaper for researchers to access and analyse large datasets that are stored on these cloud services.
Additionally, satellites such as Landsat 8 and Sentinel satellites 1-4 have made access to high resolution (10-60m for Sentinel 2, 30-100m Landsat 8) multispectral weekly datasets possible. This has allowed researchers to develop a better understanding of how processes in a landscape occur in both time and space.
|
SARVA semantics
SAEON uLwazi has been primarily focused on the creation of data products that can be used in the South African Risk and Vulnerability Atlas (SARVA) and the Bio-Energy Atlas Project (BEA). Global change risk and vulnerability can be assessed in terms of the characteristics and interactions between drivers and stocks.
Drivers result from change in intensity, frequency or quantity of a phenomenon away from its typical baseline in the natural or human environment and can manifest in the short term (or very short term, as is the case with disasters), medium term, or long term. Stocks are the things that we value: human lives and livelihoods, infrastructure, economic value and ecosystem services, to name a few.
Observations underpin the entire conceptual framework, allowing users to perceive changes in driver functions and resulting hazards and their frequency, the characteristics of stocks, as well as corresponding responses or impacts on stocks.
Examples of remote sensing data products and processes
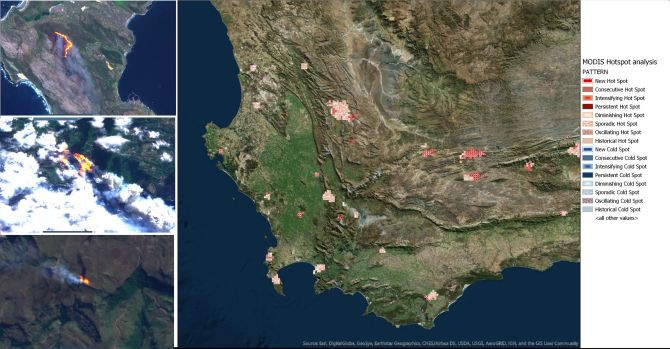
SAEON uLwazi has utilised different data sources and technologies to characterise stocks and pressures. For example, we have utilised the NASA Fire Information for Resource Management Service (FIRMS), which identifies active fires in MODIS and VIIRS imagery.
|
Active fires from Landsat 8 and Sentinel 2 imagery are classified using a simple thresholding algorithm and are added to the FIRMS data, allowing for detection of small fire events such as shack fires, which are below the detection thresholds for MODIS and VIIRS sensors.
This has allowed us to develop an understanding of the spatial and temporal distributions of fire events in South Africa and will be used in conjunction with other datasets to characterise and identify areas and populations that are vulnerable to fire, as well as determine areas where the frequency of active fires is changing and correlate that with other remotely sensed environmental variables such as vegetation cover/productivity as well as changes in land use.
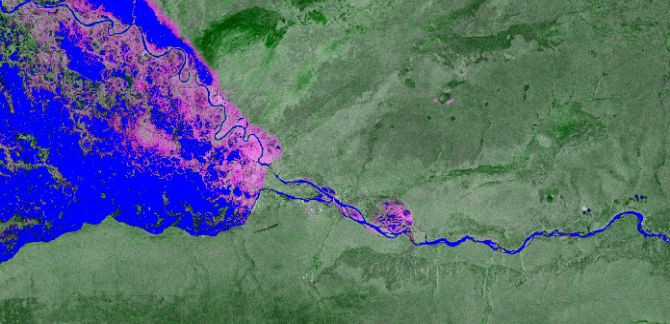
Similarly, we have been using the Google Earth Engine API to map the extent of flood events. This is achieved using Sentinel 1 Synthetic Aperture Radar (SAR) data as it has the ability to penetrate clouds.
This data had a thresholding algorithm applied to it which classifies areas according to the surface roughness, as inundated areas are smoother than areas which are covered by vegetation. This has allowed us to map flood extents over different time series and it will be used to create a dataset which describes the areas that are frequently inundated.
|
Additionally, it allows us to have near real time (NRT) monitoring of the surface extent of all water bodies in South Africa.
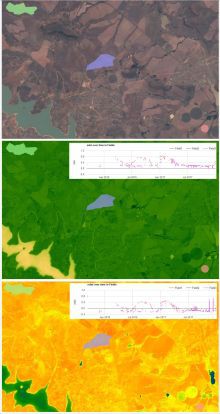
The ability to query large time series of remotely sensed images also provides us with opportunities for mapping ecosystem changes. The work that SAEON uLwazi is performing in this field is still exploratory as we are still developing an understanding of how best to perform change series analyses over multi-temporal datasets. We have been pulling out changes in vegetation productivity as well as foliar moisture content over time, which can be correlated with long-term weather datasets when they become available as well as ecosystem adaptation to disturbances.
These time series will be compared to formally published land cover change between 1990 and 2013 and can also be used to determine seasonality or temporal variation of biomass sources for energy, for example agricultural residue, forestry residue, or alien invasives.
Way forward…
While tools have become available which make observing changes in phenomena within a landscape considerably more powerful and accessible within recent years, a lot of work still needs to be performed to develop and integrate the findings of these analyses within the broader understanding of landscape change and more particularly, how that change relates to specific thematic areas of interest.
The uLwazi team is currently using this data in conjunction with other publicly available datasets from a number of stakeholders in order to develop profiles of how stocks and drivers have changed over time. We feel that the work that we are performing would be of interest to the broader SAEON collective as there is considerable potential for correlations between the remote sensing processes and the observations that SAEON scientists are performing at a local level. This will require close collaboration with subject matter experts who have previously not had the local capacity to answer these types of questions.
The SAEON uLwazi team is in the process of developing capacity in the fields of machine learning and other advanced analytics to develop models which can be used to understand the drivers of local change and we look forward to collaborating with other members of SAEON to see where this journey leads.
If you have an idea that you would like to explore, please chat to us about it! We would love to help.
Contacts
LINKS TO DATA SERVICES
1. Web Map Services (WMS)
1.1 NASA Fire Information for Resource Management VIIRS and MODIS Datasets
https://firms.modaps.eosdis.nasa.gov/wms/?REQUEST=GetMap&layers=fires_viirs,fires_modis&TIME=2017-03-31&WIDTH=1024&HEIGHT=512&colors=240+40+40,250+200+50&size=2,2&BBOX=-180,-90,180,90
1.2 Sentinel hub (https://www.sentinel-hub.com)
1.2.1 Sentinel Active Fires (https://services.sentinel-hub.com/ogc/wms/6d88f64c-f340-4c66-8809-7260bdcbbc25/?REQUEST=GetCapabilities)
1.2.2 Sentinel Vegetation Indices (https://services.sentinel-hub.com/ogc/wms/9b82a894-be8f-465d-a064-2c895d49fff7/?REQUEST=GetCapabilities)
2. Free Cloud Processing APIs
2.1 Google Earth Engine (http://code.earthengine.google.com/)
2.2 Sentinel Playground (https://apps.sentinel-hub.com/sentinel-playground?source=S2&lat=40.4&Ing=-3.730000000000018&zoom=12&preset=1_NATURAL_COLOR&layers=
B01,B02,B03&maxcc=20&gain=1.0&gamma=1.0&time=2015-01-01%7C2018-06-25&atmFilter=&showDates=false)
Further reading
Clement, M. A., Kilsby, C. G. & Moore, P. (2017). Multi‐temporal synthetic aperture radar flood mapping using change detection. Journal of Flood Risk Management.https://earthdata.nasa.gov/earth-observation-data/near-real-time/firms