
Tracing water in the Jonkershoek catchment
|


When drought hits, we all start to wonder, where does the water come from? Where do the rivers start?
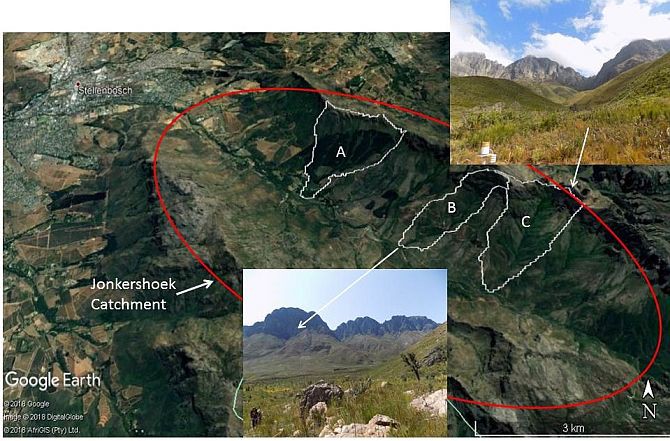
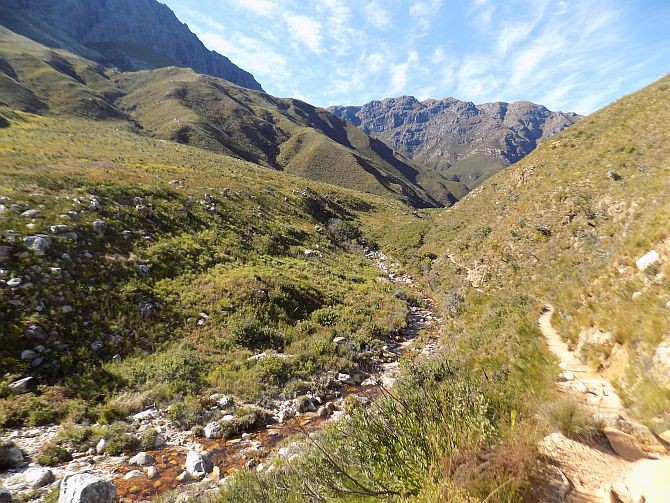
The Jonkershoek Valley is a mountain headwater catchment area just northeast of Stellenbosch. Walking through Jonkershoek can be described as thrilling and picture perfect, from the spectacular scenery of the rugged mountain terrain and beautiful clouds kissing the grey mountain tops to the view of slopes richly covered by thick bushes of the indigenous fynbos vegetation. Sounds of the reddish-brown water making its way down the river can be heard from afar.
The mountain peaks rise to an elevation of 1 494 metres above sea level. These mountains, located within the Table Mountain Group (TMG) geological formation, are not just home to the indigenous fynbos flora, but they are also a major source of bulk water supply.
|
The TMG extends from the Western Cape region through to parts of the Eastern Cape Province. Surface and groundwater from these mountains and the TMG aquifer are used to meet agricultural and domestic requirements (Wu, 2005; Duah, 2010).
Most of the rainfall in the region is received in the mountains, such as those of Jonkershoek, with a measured average annual rainfall of 3 345 mm/a (Diamond, 2014). The headwater catchments in the mountains are the main contributors of water to the region’s rivers. Their geomorphology, soils and vegetation regulate flow to both surface and groundwater and impact erosion and flooding.
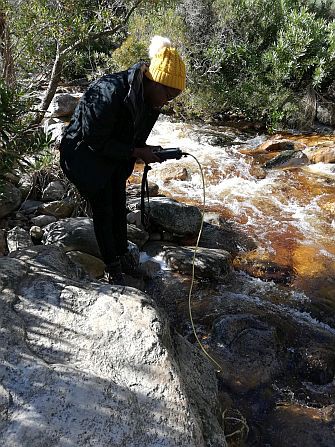
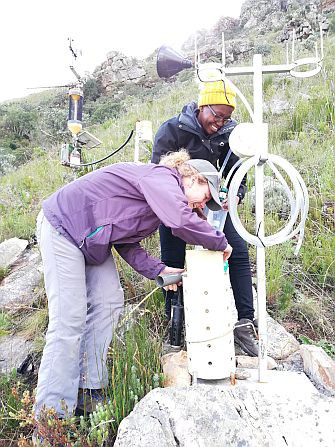
Retang Mokua, currently pursuing her PhD at the University of the Western Cape under SAEON and the NRF Professional Development Programme**, is collecting water-level and water-chemistry data in the Jonkershoek catchment to investigate surface and subsurface flow paths and develop a conceptual flow model. This study forms part of the SAEON Fynbos Node’s long-term monitoring of terrestrial and freshwater parameters and aims to improve understanding of hydrological processes to be able to predict the long-term impacts of global change.
Why is this study relevant?
Recently we have seen a large decline in surface water resources in the Western Cape region. Global change drivers such as climate change, land-use change, invasive alien species and altered wildfire regimes are among the main suspects contributing to this crisis.
Activities that reduce streamflow upstream affect the water supply downstream. There is a need for long-term management of water resources in the Cape region to gain more in-depth insights on the impacts of these drivers.
|
For this reason, a fuller and more quantitative understanding of the hydrological processes in these catchments is critical. This means understanding streamflow generation processes, which describe the pathways followed by water on the land surface and through the subsurface until it reaches the stream.
This is fundamental for improving hydrological models, which are used for:
- Flood, erosion and drought impact predictions,
- Evaluation of water resources and planning terrestrial and aquatic ecosystem preservation, and
- Assessment of climate and land-use change impacts on the hydrological responses (Gonzales et al., 2009).
The Jonkershoek catchment provides a useful study catchment for this work, both as a water source catchment itself and serving as an example of regional mountain headwater catchment processes. The Jonkershoek River is one of the major tributaries of the Eerste River, which supplies water for numerous purposes downstream to surrounding municipalities.
In addition, the headwater catchment of the Berg River, which feeds the Berg River Dam, borders the Jonkershoek catchment to the northeast. This upper Berg River catchment has similar rainfall and geology, and likely very similar catchment processes.
Jonkershoek has one of the longest streamflow data records in the world, with monitoring dating back to the 1940s. It was initially set as a site for monitoring the impact of afforestation on streamflow. However, there is still little quantitative understanding of catchment hydrological processes with relevance to surface and subsurface flows.
This study aims to fill the knowledge gap. The study focuses on three sub-catchments within the Jonkershoek valley to assess their streamflow-generation mechanisms and to look at spatial and temporal variation.
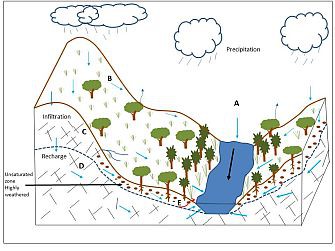
Streamflow generation mechanisms is not an A-to-B process
Not all the rain that falls on the catchment reaches the stream at the same time. Some will never reach the stream at all. Water contributing to streamflow can reach the stream through various pathways, across the land surface, through the soil, through different fractured or porous rock layers, and therefore water can reach streams within minutes or even decades after falling as rain.
There is spatial and temporal heterogeneity in the dominance of different flow paths in landscapes. The complexity of determining the mix of streamflow generation pathways increases with catchment size. Large rivers often represent highly heterogeneous mixtures of water types (Vitvar et al., 2003). The different flow processes are illustrated below.
|
Tracing water sources and pathways using isotopic and chemical signatures
Investigation of hydrological processes in semi-arid regions such as Jonkershoek can be difficult due to high variability in rainfall and high evaporation rates. In addition, in the TMG aquifer, the irregularly fractured nature of the geology and areas of high permeability complicate water-level predictions (Diamond, 2014). Measuring quantities of stable isotopes of hydrogen and oxygen in water provides a suitable solution to investigate these processes.
Why stable isotopes? These environmental tracers are present in all phases of the hydrological cycle. They are conservative, which means they do not change as they move through the water cycle, and, importantly, collecting samples is relatively easy, as are the analyses.
Research using these environmental tracers has been improving the understanding of hydrological processes for the past three to four decades. A combination of environmental isotope and other hydrochemical data can provide an insight on water pathways and water sources.
The ratios of isotopes and the concentrations of other ions change compared with those of the rainfall as water moves through soil and rock, and some are evaporated or used by plants. These methods can even be applied to determine the sources of your bottled water!
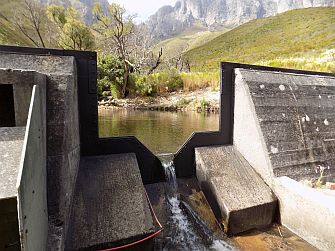
Working with tracer data to understand hydrological processes can provide clearer results when combined with hydrometric data. Hydrometric data includes streamflow (discharge), precipitation, evapotranspiration, soil moisture and groundwater-level measurements. In Jonkershoek, streamflow is collected from the network of V-notch gauging weirs, while rainfall data is collected from the tipping buckets rain gauges.
This study uses isotopic and chemical data from analysis of water from different sources, such as streams, piezometers, springs and rainfall in Jonkershoek, alongside streamflow and soil and groundwater responses to rainfall, to unravel the mystery behind the streamflow processes in this catchment.
The results will provide an improved understanding of the catchment hydrological processes and aid in improving hydrological modelling. These models will help assess the impact of global change predictions and help in improving water resource management in the Cape regions as well as preservation of the indigenous vegetation.
|
Further reading
- Diamond, E. R. 2014. Stable isotope hydrology of the Table Mountain Group. PhD dissertation. University of Cape Town. Retrieved from https://open.uct.ac.za/handle/11427/21190
- Duah, A. A. 2010. Sustainable utilization of Table Mountain Group aquifers. PhD dissertation. University of the Western Cape.
- Gonzales, A. L., Nonner, J., Heijkers, J. and Uhlenbrook, S. 2009. Comparison of different base flow separation methods in a lowland catchment. Hydrology and Earth System Sciences, 13(11), 2055-2068. https://doi.org/10.5194/hess-13-2055-2009
- Vitvar, T., Aggarwal, P. K. and Mcdonnell, J. J. 2003. 12. A Review of Isotope Applications in Catchment Hydrology, 151-169.
- Wu, Y. 2005. Groundwater recharge estimation in Table Mountain Group aquifer systems. PhD dissertation. University of the Western Cape.
* Supervised by Dr J Nel, Dr J Glenday and Dr N Allsopp
** The Professional Development Programme of the Department of Science and Technology and the National Research Foundation aims to accelerate the development of scientists and research professionals in key research areas.