
Eddy who? Introducing the Fynbos Node’s eddy covariance site in Jonkershoek
|


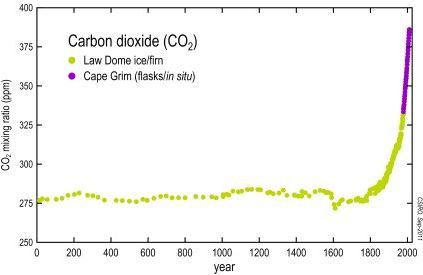
It has become common knowledge that rising CO2 levels in the earth’s atmosphere are a major contributor to global warming.
You may even have seen the famous “hockey stick” graphs (if not, see here) that plot the recent dramatic increase in levels of atmospheric CO2, methane and other greenhouse gases against pre-industrial levels.
|
Environmental scientists around the globe have set up an impressive network of monitoring sites to record these changes in real time and to help understand the relationship between these gases and local ecosystems. So how does one measure CO2 concentration in a way that allows comparison with other stations and helps you understand what your local ecosystem is doing?
Different methods of measurement are available, but a popular one is the eddy covariance method. In a nutshell, this method measures the changes in gas concentrations (in this case CO2 and water vapour) as well as the direction and speed of air movement through a defined space at a high frequency.
This movement of matter (CO2 or H2O) through a specific area over a defined time period is also known as “flux”. Let’s examine this further.
|
Introducing Eddy…
Air movement (wind) typically occurs in a series of turbulent or rolling movements called “eddies”. Eddies are caused by differences in temperature in the atmosphere as well as the roughness of obstacles in the path of moving air. Eddies come in many different sizes, move at different speeds and contain different concentrations of gases (including CO2 and water vapour).
The term “covariance” refers to the simultaneous (“co-”) measurement of changes (“variance”) in air movement and gas concentration. Measurements are taken 10 times per second using two main instruments namely, a sonic anemometer (wind speed and direction) and an infrared gas analyser (CO2 and H2O concentration). The resulting data tell us whether air moving up or down had more, or less, or the same amount of CO2 or water vapour in it.
For further clarification, have a look at this helpful YouTube video put together by our long-term environmental observation colleagues at NEON (National Ecological Observatory Network) in the United States.
Over longer time scales (a year or more), this allows us to tell what the average atmospheric CO2 concentration is and to monitor trends over years. Our data can show us whether the “hockey stick” graphs are true for our sites.
At shorter time scales (hours to days to months) it helps us understand how the ecosystem is responding to variables like rainfall, drought, seasonality and fire. How much water vapour is the ecosystem releasing during a heat wave? How much CO2 does the ecosystem absorb during a growing season? How does CO2 flux differ before and after a fire and how much CO2 is released during a fire? (See CO2 data during a fire measured by TERN, the Terrestrial Ecosystem Research Network in Australia, here). How does a change in vegetation cover or species alter the ecosystem’s ability to absorb CO2? Does the ecosystem release more water when it is composed of exotic Acacias or indigenous fynbos?
These are a few of the questions eddy covariance systems can help answer by directly measuring the variables that matter, on a continuous basis.
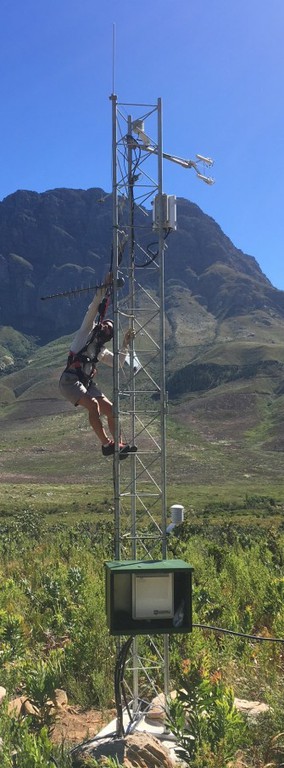
Eddy comes to Jonkershoek
February 2019 saw the completion of an eddy covariance installation in SAEON’s Jonkershoek experimental catchment near Stellenbosch in the Western Cape. The station is located in a patch of fynbos.
This site burnt during 2015, so we expect to see how CO2 uptake changes as the vegetation moves from a juvenile to a mature state.
|